BREAKOUT BUY PATTERN
TUTORIAL
(This was a tutorial in the Jan. 3 Issue of the newsletter, published just after we entered the position on ELON. This
stock rallied up to a high of 113 during the next several months, from our original entry at 13, proving our assumptions
in the first paragraph correct.)
This last week we purchased Echelon (ELON), and as it was a fine example of a very recognizable buy pattern (actually
two patterns combined), we would like to use it as an example in this tutorial. Echelon came to our attention originally
as a tip from one of our readers, as some of our stocks do, and in our research we decided that it did indeed have a
very good fundamental outlook, as the producer of the LonWorks chips that control automation of machinery in production
lines and in the home, which is a wide open field for the next decade. This company has set itself up very nicely to be
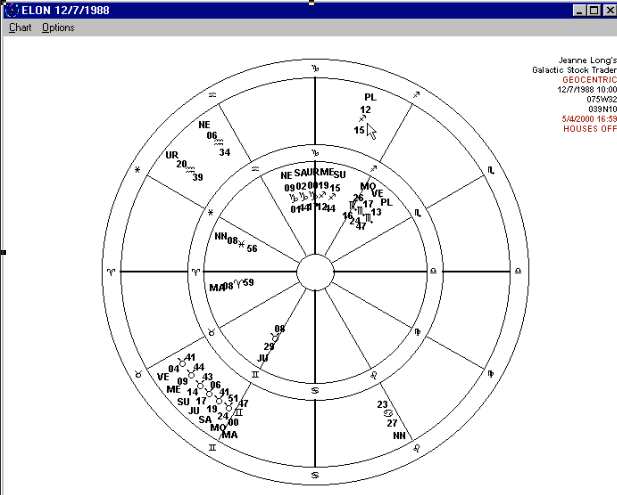
the leader in this new frontier. Apart from that, the Incorporation chart shows Jupiter in late Taurus, which means that
it will begin to receive energy from all of the planets that will be moving into Taurus over the first quarter of this
year, culminating in Jupiter and Saturn conjunct the natal Jupiter position. The chart above shows all of the planets
moving through this aspect with the position of natal Jupiter during the month of May, 2000. After transiting Jupiter
conjuncts the natal position, we may look to take profits as Saturn makes it's approach, but we should have several
months for very good gains before that happens.
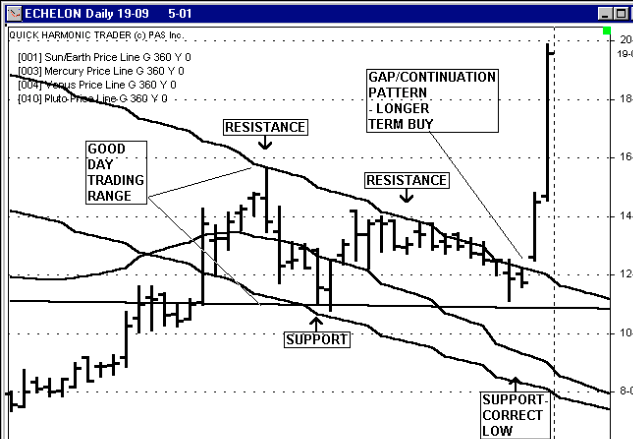
For the past several weeks, Echelon has been trapped in a trading range which was defined at the upper limits by the first harmonic mirror of Venus, which has been holding the highs and creating a short-term downtrend. The lower levels of this trading range have been defined by the first harmonic mirror of Pluto, which has defined a couple of nice lows. Within this trading range we have been day-trading this stock and having a bit of fun, but waiting for the breakout above Venus for the initiation of a longer-term position. On Thursday of last week the price gapped above Venus after touching Pluto for the last time. We were alerted of this potential by the fact that the last low was very close to Pluto, and not below the line, which constituted a nice correct low, and a Standard Reversal Pattern, giving us a qualification to buy into a longer-term position. On Thursday, the qualification was doubled by a Gap/Continuation Pattern over the first harmonic Venus line. We were qualified to buy this stock for the longer-term as soon as it moved .
Even without natal analysis, you can use the Sun-Mercury-Venus mirror channels often to define good breakout buys. This
pattern of resistance followed by a breakout is extremely common when stocks are about to begin a longer-term up trend,
and as the Sun, Mercury and Venus geocentric positions are always fairly close to one another, there is always a well
defined channel of resistance created by the three. Scan your price histories with these three first harmonic lines on
your charts and you will see what we mean.
Since 1992

