THIS IS AN ORIGINAL WORK DONE IN THE 90s,
ANY OTHER PROGRAM USING ANY OF OUR ORIGINAL WORK
IS JUST COPYING PEOPLES IDEAS AND WORK,
NOT PUTTING ANY TIME AND EFFORT TO FIND SOLUTIONS
FOR REAL TRADERS
High Probability Fibonacci Zones
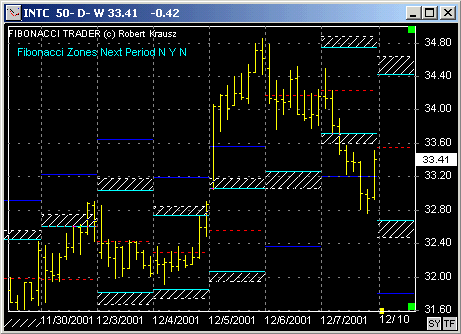
Press the icon above to toggle the Fibonacci Zones Next Period On or Off. These zones show possible support and resistance areas.

When you press this button on an INTRADAY/DAILY/WEEKLY chart the actual High Probability Fibonacci Zones table for the active symbol will show on the screen.

The Fibonacci Zones are calculated using the daily data for the symbol. The number of bars used to calculate the probabilities is shown in the Probability Matrix.
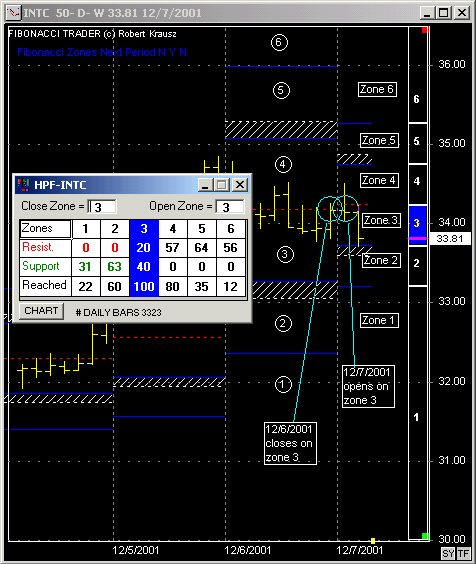
Example: #DAILY BARS 2525, means the program is using 2525 bars of INTC day daily data.
Important: We recommend that you have a minimum of 5 years of daily data for the symbol (around 1200 bars) to have more accurate probabilities.
The CLOSE-OPEN zone designations are defined as follows:
CLOSE ZONE = 3, means that the daily bar closed on the previous day zone 3.
OPEN ZONE = 3, means that the daily bar opened today in zone 3.
therefore the second the market opens things occur.
The Fibonacci Zone probabilities are calculated and they are displayed in the Probabilities Matrix.
The opening zone will be highlighted in blue. As the prices move from zone to zone, the zones will be highlighted by the blue vertical strip.
In the example there are 3 horizontal lines showing percentages the Resistance, Support and Reached.
In simple terms one can see the probabilities instantly on the open. The Resistance line (in red) shows that zone 5 has the highest resistance but if you check the bottom line (Reached) you can see that zone 5 is reached only 35% of the time. However the next highest resistance occurs in zone 4 at 57%. But now check out the frequency of how often this zone is reached. It shows 80%. Which means that during a 3 close - 3 open combo, if you you are looking to sell, then selling in zone 4 could occur 80% of the time.
Now lets look at the support line probabilities (green). The highest support occurs in zone 2, some 63% of the time that may be the best support for that day. Now check in the Reached line. You will can see that it is reached 60% of the time. If you are looking to buy, this could be advantageous zone to buy in.
On the opening of each day the Zone Matrix will display the probabilities for that day. Some days there will be useful opportunities and other days there will be none.
It is important that you use these High Probabilities Fibonacci Zones in combination with other technical tools and not as a stand alone trading plan.
Because it is not a technical tool in the normal sense of the word, combining the Fibonacci Zone Analysis with other technical tolls can highlight opportunities not really visible by themselves.
Actually it is a statistical analysis of zone pattern probabilities based on comparing yesterday's close and today's open.
This tends to display potentially profitable trading situations, by answering 3 questions.
1. How often will prices reach a specific zone.
2. If prices reach a higher zone, how often will that be the high zone for that day.
3. If prices reach a lower zone, how often will that be the low zone of the day.
Definition of resistance : Zone 1 to 5 is the higher zone for the day. Since for zone 6 there is no upper boundary, resistance for zone 6 is defined as prices breaking to close in a lower zone.
Definition of support : Zone 2 to 6 is the lower zone for the day. Since for zone 1 there is no lower boundary, support for zone 1 is defined as prices breaking to close in a higher zone.
Since 1992