THIS IS AN ORIGINAL WORK DONE IN THE 90s,
ANY OTHER PROGRAM USING ANY OF OUR ORIGINAL WORK
IS JUST COPYING PEOPLES IDEAS AND WORK,
NOT PUTTING ANY TIME AND EFFORT TO FIND SOLUTIONS
FOR REAL TRADERS
ZONE ANALYSIS
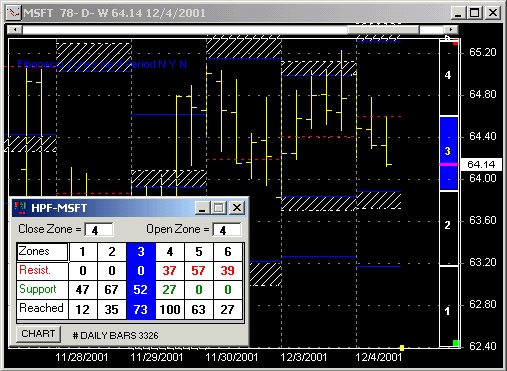
Fibonacci Trader has the “High Probability Fibonacci Zone Analysis” and the “Zone Analysis” (John Jackson) built in:

On any chart where the OWN period is “intraday” and the NEXT period is “daily” you can have the probability zones percentages on your screen.
Note that you do not need to buy tables from us, the program will do all the calculations by itself based on your daily data.
It is very important to look at the “# DAILY BARS” number. That number is the number of daily bars that the program is using to create all the statistics for the zones. A low number of bars will give statistically invalid information. Therefore, it is strongly recommended that you have at least 1000 daily bars in your data file.
Of course, the Fibonacci Trader handles all time periods volume in the same way. If you trade intraday the data vendors that the Fibonacci Trader can collect volume in real time are: S&P Comstock, Signal, BMI, DTN, MyTrack, Taltrade and Quote.com. On data vendors that use DDE links the Fibonacci Trader will only collect the last trade price
How to use these zones is explained on the Fibonacci Trader Journal # 14
More Information on High Probability Fibonacci Zones
More Information on Jackson Zones
Since 1992